Sunday, 23 April 2017

Kafka using Python

Python client for the Apache Kafka distributed stream processing system. kafka-python is designed to function much like the official java client, with a sprinkling of pythonic interfaces (e.g., consumer iterators).
kafka-python is best used with newer brokers (0.10 or 0.9), but is backwards-compatible with older versions (to 0.8.0). Some features will only be enabled on newer brokers, however; for example, fully coordinated consumer groups – i.e., dynamic partition assignment to multiple consumers in the same group – requires use of 0.9+ kafka brokers. Supporting this feature for earlier broker releases would require writing and maintaining custom leadership election and membership / health check code (perhaps using zookeeper or consul). For older brokers, you can achieve something similar by manually assigning different partitions to each consumer instance with config management tools like chef, ansible, etc. This approach will work fine, though it does not support rebalancing on failures.
Please note that the master branch may contain unreleased features. For release documentation, please see readthedocs and/or python’s inline help.
>>> pip install kafka-python

KafkaConsumer

KafkaConsumer is a high-level message consumer, intended to operate as similarly as possible to the official java client. Full support for coordinated consumer groups requires use of kafka brokers that support the Group APIs: kafka v0.9+.
The consumer iterator returns ConsumerRecords, which are simple namedtuples that expose basic message attributes: topic, partition, offset, key, and value:
>>> from kafka import KafkaConsumer
>>> consumer = KafkaConsumer('my_favorite_topic')
>>> for msg in consumer:
...     print (msg)
>>> # join a consumer group for dynamic partition assignment and offset commits
>>> from kafka import KafkaConsumer
>>> consumer = KafkaConsumer('my_favorite_topic', group_id='my_favorite_group')
>>> for msg in consumer:
...     print (msg)
>>> # manually assign the partition list for the consumer
>>> from kafka import TopicPartition
>>> consumer = KafkaConsumer(bootstrap_servers='localhost:1234')
>>> consumer.assign([TopicPartition('foobar', 2)])
>>> msg = next(consumer)
>>> # Deserialize msgpack-encoded values
>>> consumer = KafkaConsumer(value_deserializer=msgpack.loads)
>>> consumer.subscribe(['msgpackfoo'])
>>> for msg in consumer:
...     assert isinstance(msg.value, dict)

KafkaProducer

KafkaProducer is a high-level, asynchronous message producer. The class is intended to operate as similarly as possible to the official java client
>>> from kafka import KafkaProducer
>>> producer = KafkaProducer(bootstrap_servers='localhost:1234')
>>> for _ in range(100):
...     producer.send('foobar', b'some_message_bytes')
>>> # Block until a single message is sent (or timeout)
>>> future = producer.send('foobar', b'another_message')
>>> result = future.get(timeout=60)
>>> # Block until all pending messages are at least put on the network
>>> # NOTE: This does not guarantee delivery or success! It is really
>>> # only useful if you configure internal batching using linger_ms
>>> producer.flush()
>>> # Use a key for hashed-partitioning
>>> producer.send('foobar', key=b'foo', value=b'bar')
>>> # Serialize json messages
>>> import json
>>> producer = KafkaProducer(value_serializer=lambda v: json.dumps(v).encode('utf-8'))
>>> producer.send('fizzbuzz', {'foo': 'bar'})
>>> # Serialize string keys
>>> producer = KafkaProducer(key_serializer=str.encode)
>>> producer.send('flipflap', key='ping', value=b'1234')
>>> # Compress messages
>>> producer = KafkaProducer(compression_type='gzip')
>>> for i in range(1000):
...     producer.send('foobar', b'msg %d' % i)

Compression

kafka-python supports gzip compression/decompression natively. To produce or consume lz4 compressed messages, you must install lz4tools and xxhash (modules may not work on python2.6). To enable snappy compression/decompression install python-snappy (also requires snappy library).

Protocol

A secondary goal of kafka-python is to provide an easy-to-use protocol layer for interacting with kafka brokers via the python repl. This is useful for testing, probing, and general experimentation. The protocol support is leveraged to enable a KafkaClient.check_version() method that probes a kafka broker and attempts to identify which version it is running (0.8.0 to 0.10).

Usage

SimpleProducer

from kafka import SimpleProducer, KafkaClient

# To send messages synchronously
kafka = KafkaClient('localhost:9092')
producer = SimpleProducer(kafka)

# Note that the application is responsible for encoding messages to type bytes
producer.send_messages(b'my-topic', b'some message')
producer.send_messages(b'my-topic', b'this method', b'is variadic')

# Send unicode message
producer.send_messages(b'my-topic', u'你怎么样?'.encode('utf-8'))

Asynchronous Mode

# To send messages asynchronously
producer = SimpleProducer(kafka, async=True)
producer.send_messages(b'my-topic', b'async message')

# To wait for acknowledgements
# ACK_AFTER_LOCAL_WRITE : server will wait till the data is written to
#                         a local log before sending response
# ACK_AFTER_CLUSTER_COMMIT : server will block until the message is committed
#                            by all in sync replicas before sending a response
producer = SimpleProducer(kafka, async=False,
                          req_acks=SimpleProducer.ACK_AFTER_LOCAL_WRITE,
                          ack_timeout=2000,
                          sync_fail_on_error=False)

responses = producer.send_messages(b'my-topic', b'another message')
for r in responses:
    logging.info(r.offset)

# To send messages in batch. You can use any of the available
# producers for doing this. The following producer will collect
# messages in batch and send them to Kafka after 20 messages are
# collected or every 60 seconds
# Notes:
# * If the producer dies before the messages are sent, there will be losses
# * Call producer.stop() to send the messages and cleanup
producer = SimpleProducer(kafka, async=True,
                          batch_send_every_n=20,
                          batch_send_every_t=60)

Keyed messages

from kafka import (
    KafkaClient, KeyedProducer,
    Murmur2Partitioner, RoundRobinPartitioner)

kafka = KafkaClient('localhost:9092')

# HashedPartitioner is default (currently uses python hash())
producer = KeyedProducer(kafka)
producer.send_messages(b'my-topic', b'key1', b'some message')
producer.send_messages(b'my-topic', b'key2', b'this methode')

# Murmur2Partitioner attempts to mirror the java client hashing
producer = KeyedProducer(kafka, partitioner=Murmur2Partitioner)

# Or just produce round-robin (or just use SimpleProducer)
producer = KeyedProducer(kafka, partitioner=RoundRobinPartitioner)

KafkaConsumer

from kafka import KafkaConsumer

# To consume messages
consumer = KafkaConsumer('my-topic',
                         group_id='my_group',
                         bootstrap_servers=['localhost:9092'])
for message in consumer:
    # message value is raw byte string -- decode if necessary!
    # e.g., for unicode: `message.value.decode('utf-8')`
    print("%s:%d:%d: key=%s value=%s" % (message.topic, message.partition,
                                         message.offset, message.key,
                                         message.value))
messages (m) are namedtuples with attributes:
  • m.topic: topic name (str)
  • m.partition: partition number (int)
  • m.offset: message offset on topic-partition log (int)
  • m.key: key (bytes - can be None)
  • m.value: message (output of deserializer_class - default is raw bytes)
  from kafka import KafkaConsumer

  # more advanced consumer -- multiple topics w/ auto commit offset
  # management
  consumer = KafkaConsumer('topic1', 'topic2',
                           bootstrap_servers=['localhost:9092'],
                           group_id='my_consumer_group',
                           auto_commit_enable=True,
                           auto_commit_interval_ms=30 * 1000,
                           auto_offset_reset='smallest')

  # Infinite iteration
  for m in consumer:
    do_some_work(m)

    # Mark this message as fully consumed
    # so it can be included in the next commit
    #
    # **messages that are not marked w/ task_done currently do not commit!
    consumer.task_done(m)

  # If auto_commit_enable is False, remember to commit() periodically
  consumer.commit()

  # Batch process interface
  while True:
    for m in kafka.fetch_messages():
      process_message(m)
      consumer.task_done(m)


Configuration settings can be passed to constructor,
otherwise defaults will be used:
    client_id='kafka.consumer.kafka',
    group_id=None,
    fetch_message_max_bytes=1024*1024,
    fetch_min_bytes=1,
    fetch_wait_max_ms=100,
    refresh_leader_backoff_ms=200,
    bootstrap_servers=[],
    socket_timeout_ms=30*1000,
    auto_offset_reset='largest',
    deserializer_class=lambda msg: msg,
    auto_commit_enable=False,
    auto_commit_interval_ms=60 * 1000,
    consumer_timeout_ms=-1

Configuration parameters are described in more detail at
http://kafka.apache.org/documentation.html#highlevelconsumerapi

Multiprocess consumer

from kafka import KafkaClient, MultiProcessConsumer

kafka = KafkaClient('localhost:9092')

# This will split the number of partitions among two processes
consumer = MultiProcessConsumer(kafka, b'my-group', b'my-topic', num_procs=2)

# This will spawn processes such that each handles 2 partitions max
consumer = MultiProcessConsumer(kafka, b'my-group', b'my-topic',
                                partitions_per_proc=2)

for message in consumer:
    print(message)

for message in consumer.get_messages(count=5, block=True, timeout=4):
    print(message)

Low level

from kafka import KafkaClient, create_message
from kafka.protocol import KafkaProtocol
from kafka.common import ProduceRequest

kafka = KafkaClient('localhost:9092')

req = ProduceRequest(topic=b'my-topic', partition=1,
    messages=[create_message(b'some message')])
resps = kafka.send_produce_request(payloads=[req], fail_on_error=True)
kafka.close()

resps[0].topic      # b'my-topic'
resps[0].partition  # 1
resps[0].error      # 0 (hopefully)
resps[0].offset     # offset of the first message sent in this request
Intro to Kafka

18:16 Posted by SRE Hacks , , , , , , No comments

Introduction

Apache Kafk is a distributed streaming platform. What exactly does that mean?

We think of a streaming platform as having three key capabilities:
  1. It lets you publish and subscribe to streams of records. In this respect it is similar to a message queue or enterprise messaging system.
  2. It lets you store streams of records in a fault-tolerant way.
  3. It lets you process streams of records as they occur.
What is Kafka good for?
It gets used for two broad classes of application:
  1. Building real-time streaming data pipelines that reliably get data between systems or applications
  2. Building real-time streaming applications that transform or react to the streams of data
To understand how Kafka does these things, let's dive in and explore Kafka's capabilities from the bottom up.
First a few concepts:
  • Kafka is run as a cluster on one or more servers.
  • The Kafka cluster stores streams of records in categories called topics.
  • Each record consists of a key, a value, and a timestamp.
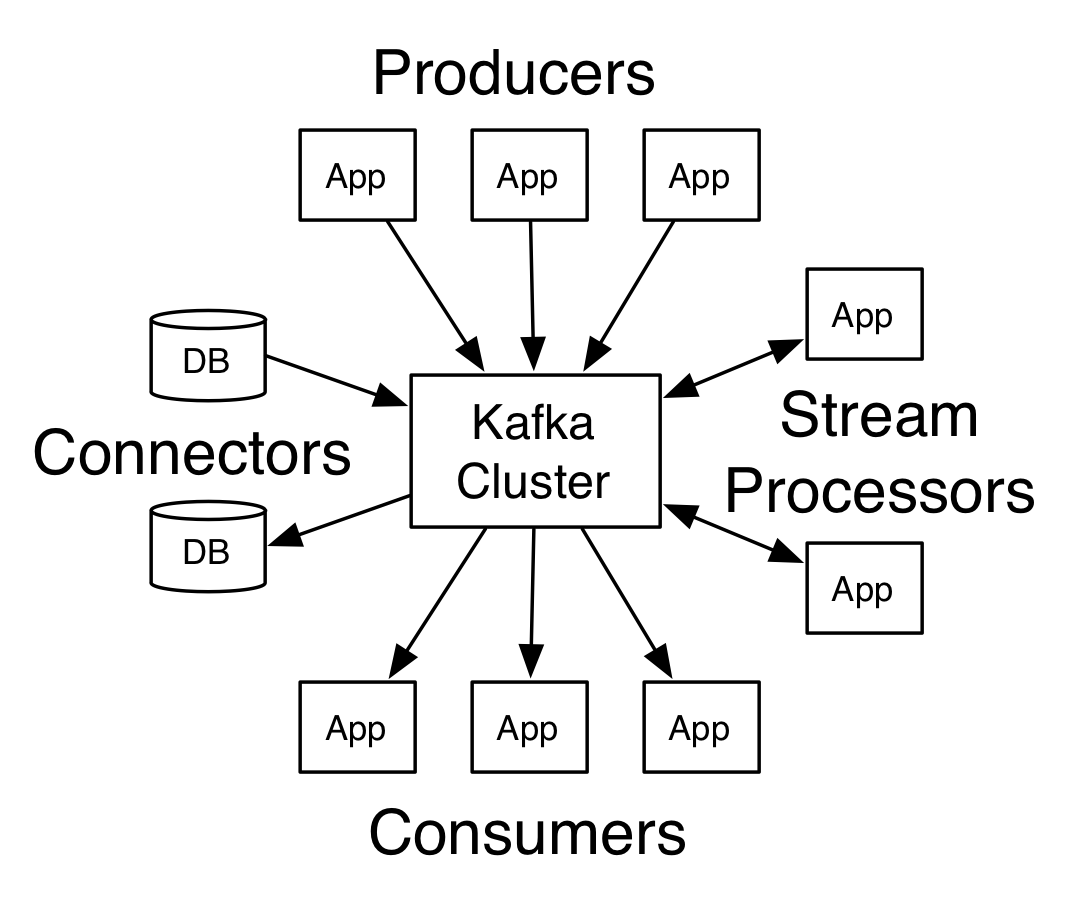
Kafka has four core APIs:
  • The Producer API allows an application to publish a stream of records to one or more Kafka topics.
  • The Consumer API allows an application to subscribe to one or more topics and process the stream of records produced to them.
  • The Streams API allows an application to act as a stream processor, consuming an input stream from one or more topics and producing an output stream to one or more output topics, effectively transforming the input streams to output streams.
  • The Connector API allows building and running reusable producers or consumers that connect Kafka topics to existing applications or data systems. For example, a connector to a relational database might capture every change to a table.
In Kafka the communication between the clients and the servers is done with a simple, high-performance, language agnostic TCP protocol. This protocol is versioned and maintains backwards compatibility with older version. We provide a Java client for Kafka, but clients are available in many languages.

Topics and Logs

Let's first dive into the core abstraction Kafka provides for a stream of records—the topic.
A topic is a category or feed name to which records are published. Topics in Kafka are always multi-subscriber; that is, a topic can have zero, one, or many consumers that subscribe to the data written to it.
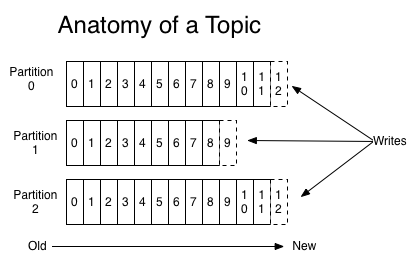
For each topic, the Kafka cluster maintains a partitioned log that looks like this:
Each partition is an ordered, immutable sequence of records that is continually appended to—a structured commit log. The records in the partitions are each assigned a sequential id number called the offset that uniquely identifies each record within the partition.
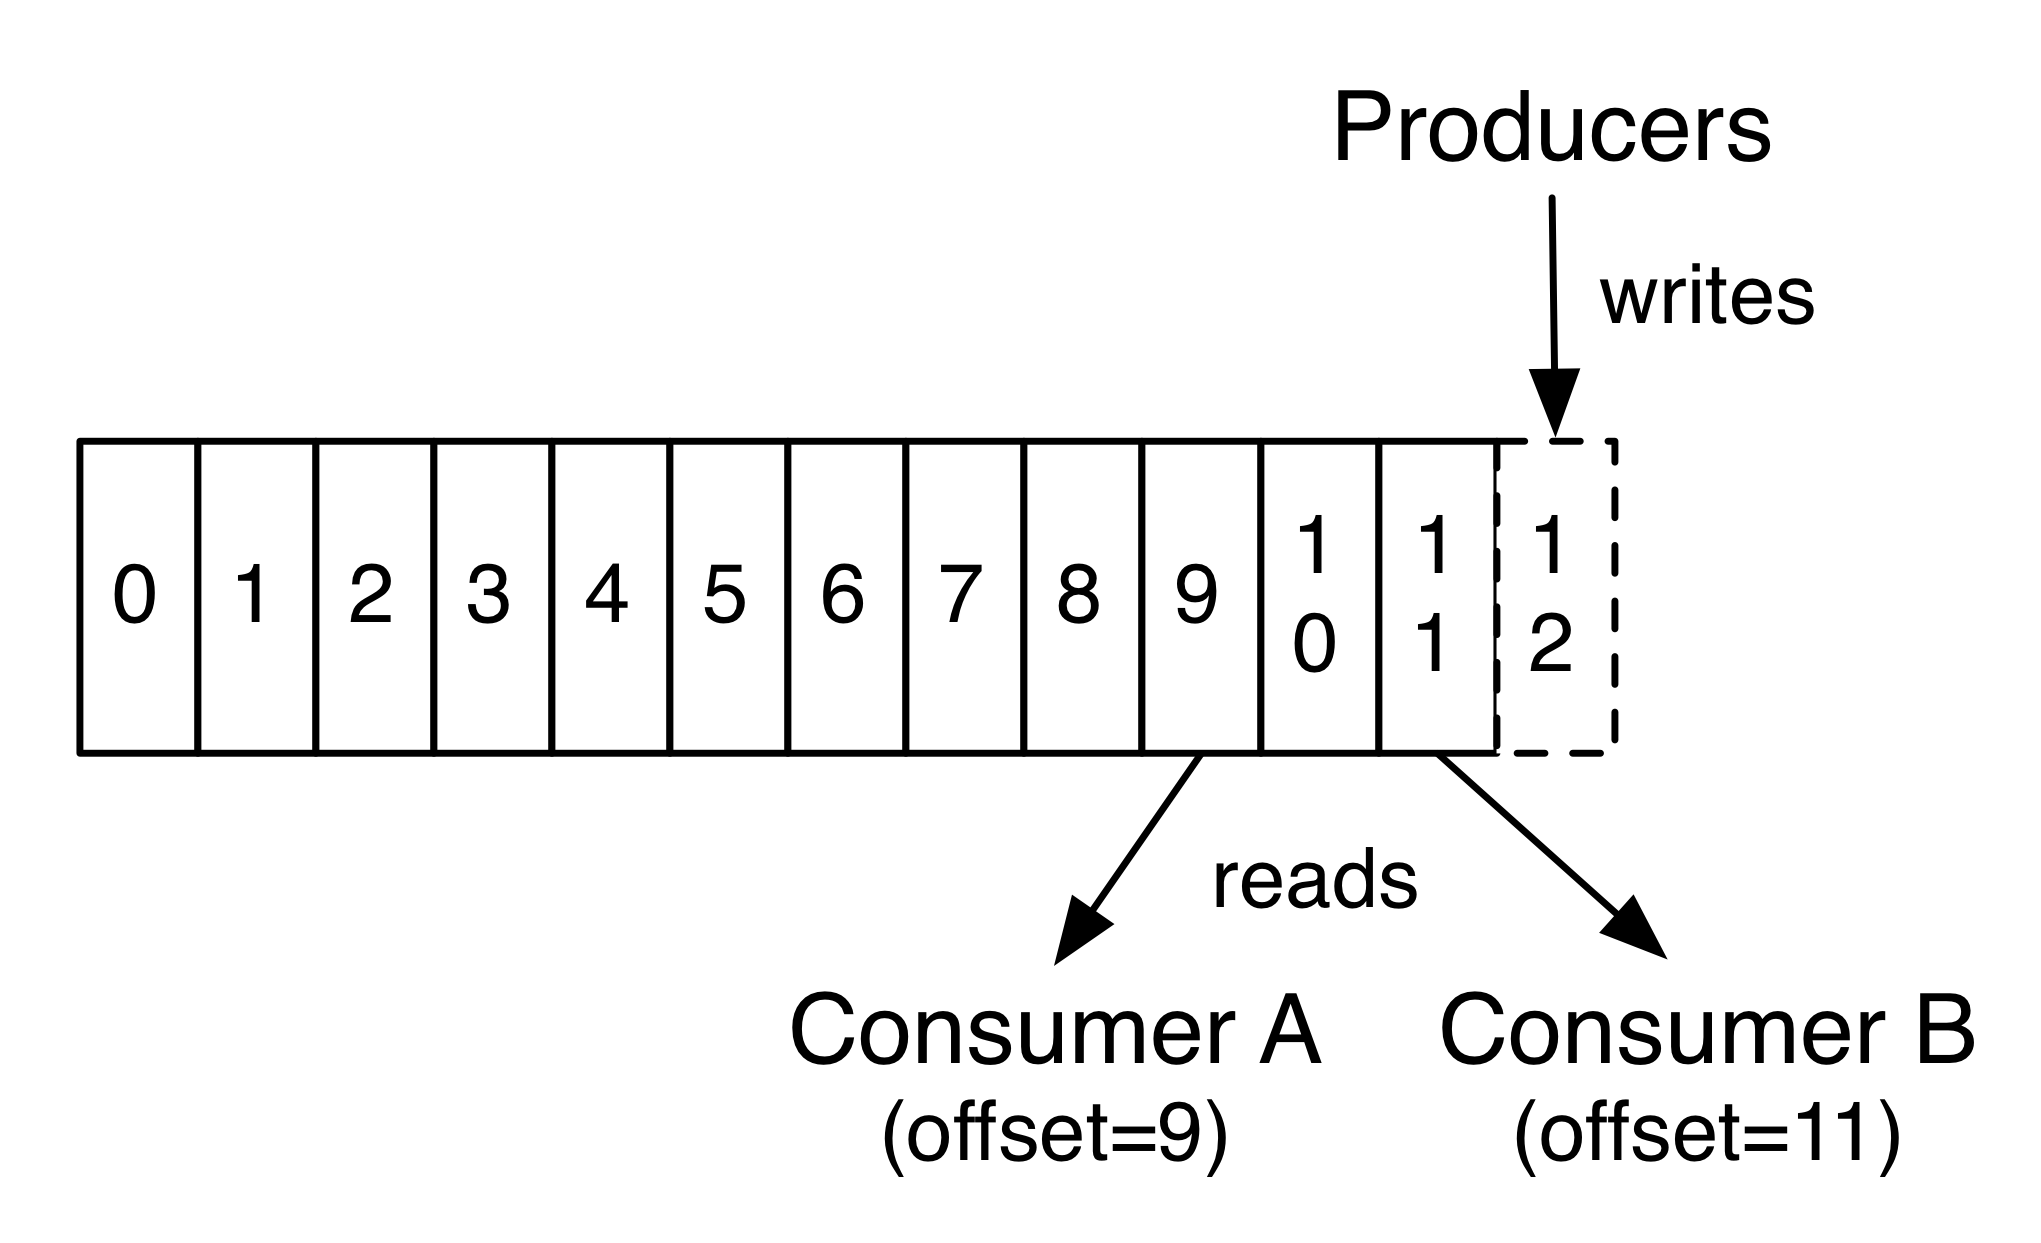
The Kafka cluster retains all published records—whether or not they have been consumed—using a configurable retention period. For example, if the retention policy is set to two days, then for the two days after a record is published, it is available for consumption, after which it will be discarded to free up space. Kafka's performance is effectively constant with respect to data size so storing data for a long time is not a problem.
In fact, the only metadata retained on a per-consumer basis is the offset or position of that consumer in the log. This offset is controlled by the consumer: normally a consumer will advance its offset linearly as it reads records, but, in fact, since the position is controlled by the consumer it can consume records in any order it likes. For example a consumer can reset to an older offset to reprocess data from the past or skip ahead to the most recent record and start consuming from "now".
This combination of features means that Kafka consumers are very cheap—they can come and go without much impact on the cluster or on other consumers. For example, you can use our command line tools to "tail" the contents of any topic without changing what is consumed by any existing consumers.
The partitions in the log serve several purposes. First, they allow the log to scale beyond a size that will fit on a single server. Each individual partition must fit on the servers that host it, but a topic may have many partitions so it can handle an arbitrary amount of data. Second they act as the unit of parallelism—more on that in a bit.

Distribution

The partitions of the log are distributed over the servers in the Kafka cluster with each server handling data and requests for a share of the partitions. Each partition is replicated across a configurable number of servers for fault tolerance.
Each partition has one server which acts as the "leader" and zero or more servers which act as "followers". The leader handles all read and write requests for the partition while the followers passively replicate the leader. If the leader fails, one of the followers will automatically become the new leader. Each server acts as a leader for some of its partitions and a follower for others so load is well balanced within the cluster.

Producers

Producers publish data to the topics of their choice. The producer is responsible for choosing which record to assign to which partition within the topic. This can be done in a round-robin fashion simply to balance load or it can be done according to some semantic partition function (say based on some key in the record). More on the use of partitioning in a second!

Consumers

Consumers label themselves with a consumer group name, and each record published to a topic is delivered to one consumer instance within each subscribing consumer group. Consumer instances can be in separate processes or on separate machines.
If all the consumer instances have the same consumer group, then the records will effectively be load balanced over the consumer instances.
If all the consumer instances have different consumer groups, then each record will be broadcast to all the consumer processes.
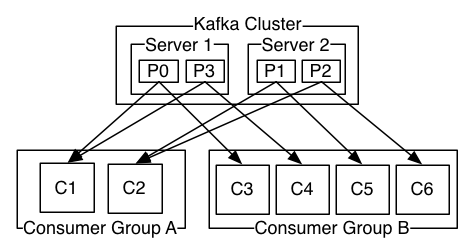
A two server Kafka cluster hosting four partitions (P0-P3) with two consumer groups. Consumer group A has two consumer instances and group B has four.
More commonly, however, we have found that topics have a small number of consumer groups, one for each "logical subscriber". Each group is composed of many consumer instances for scalability and fault tolerance. This is nothing more than publish-subscribe semantics where the subscriber is a cluster of consumers instead of a single process.
The way consumption is implemented in Kafka is by dividing up the partitions in the log over the consumer instances so that each instance is the exclusive consumer of a "fair share" of partitions at any point in time. This process of maintaining membership in the group is handled by the Kafka protocol dynamically. If new instances join the group they will take over some partitions from other members of the group; if an instance dies, its partitions will be distributed to the remaining instances.
Kafka only provides a total order over records within a partition, not between different partitions in a topic. Per-partition ordering combined with the ability to partition data by key is sufficient for most applications. However, if you require a total order over records this can be achieved with a topic that has only one partition, though this will mean only one consumer process per consumer group.

Guarantees

At a high-level Kafka gives the following guarantees:
  • Messages sent by a producer to a particular topic partition will be appended in the order they are sent. That is, if a record M1 is sent by the same producer as a record M2, and M1 is sent first, then M1 will have a lower offset than M2 and appear earlier in the log.
  • A consumer instance sees records in the order they are stored in the log.
  • For a topic with replication factor N, we will tolerate up to N-1 server failures without losing any records committed to the log.
More details on these guarantees are given in the design section of the documentation.

Kafka as a Messaging System

How does Kafka's notion of streams compare to a traditional enterprise messaging system?
Messaging traditionally has two models: queuing and publish-subscribe. In a queue, a pool of consumers may read from a server and each record goes to one of them; in publish-subscribe the record is broadcast to all consumers. Each of these two models has a strength and a weakness. The strength of queuing is that it allows you to divide up the processing of data over multiple consumer instances, which lets you scale your processing. Unfortunately, queues aren't multi-subscriber—once one process reads the data it's gone. Publish-subscribe allows you broadcast data to multiple processes, but has no way of scaling processing since every message goes to every subscriber.
The consumer group concept in Kafka generalizes these two concepts. As with a queue the consumer group allows you to divide up processing over a collection of processes (the members of the consumer group). As with publish-subscribe, Kafka allows you to broadcast messages to multiple consumer groups.
The advantage of Kafka's model is that every topic has both these properties—it can scale processing and is also multi-subscriber—there is no need to choose one or the other.
Kafka has stronger ordering guarantees than a traditional messaging system, too.
A traditional queue retains records in-order on the server, and if multiple consumers consume from the queue then the server hands out records in the order they are stored. However, although the server hands out records in order, the records are delivered asynchronously to consumers, so they may arrive out of order on different consumers. This effectively means the ordering of the records is lost in the presence of parallel consumption. Messaging systems often work around this by having a notion of "exclusive consumer" that allows only one process to consume from a queue, but of course this means that there is no parallelism in processing.
Kafka does it better. By having a notion of parallelism—the partition—within the topics, Kafka is able to provide both ordering guarantees and load balancing over a pool of consumer processes. This is achieved by assigning the partitions in the topic to the consumers in the consumer group so that each partition is consumed by exactly one consumer in the group. By doing this we ensure that the consumer is the only reader of that partition and consumes the data in order. Since there are many partitions this still balances the load over many consumer instances. Note however that there cannot be more consumer instances in a consumer group than partitions.

Kafka as a Storage System

Any message queue that allows publishing messages decoupled from consuming them is effectively acting as a storage system for the in-flight messages. What is different about Kafka is that it is a very good storage system.
Data written to Kafka is written to disk and replicated for fault-tolerance. Kafka allows producers to wait on acknowledgement so that a write isn't considered complete until it is fully replicated and guaranteed to persist even if the server written to fails.
The disk structures Kafka uses scale well—Kafka will perform the same whether you have 50 KB or 50 TB of persistent data on the server.
As a result of taking storage seriously and allowing the clients to control their read position, you can think of Kafka as a kind of special purpose distributed filesystem dedicated to high-performance, low-latency commit log storage, replication, and propagation.

Kafka for Stream Processing

It isn't enough to just read, write, and store streams of data, the purpose is to enable real-time processing of streams.
In Kafka a stream processor is anything that takes continual streams of data from input topics, performs some processing on this input, and produces continual streams of data to output topics.
For example, a retail application might take in input streams of sales and shipments, and output a stream of reorders and price adjustments computed off this data.
It is possible to do simple processing directly using the producer and consumer APIs. However for more complex transformations Kafka provides a fully integrated Streams API. This allows building applications that do non-trivial processing that compute aggregations off of streams or join streams together.
This facility helps solve the hard problems this type of application faces: handling out-of-order data, reprocessing input as code changes, performing stateful computations, etc.
The streams API builds on the core primitives Kafka provides: it uses the producer and consumer APIs for input, uses Kafka for stateful storage, and uses the same group mechanism for fault tolerance among the stream processor instances.

Putting the Pieces Together

This combination of messaging, storage, and stream processing may seem unusual but it is essential to Kafka's role as a streaming platform.
A distributed file system like HDFS allows storing static files for batch processing. Effectively a system like this allows storing and processing historical data from the past.
A traditional enterprise messaging system allows processing future messages that will arrive after you subscribe. Applications built in this way process future data as it arrives.
Kafka combines both of these capabilities, and the combination is critical both for Kafka usage as a platform for streaming applications as well as for streaming data pipelines.
By combining storage and low-latency subscriptions, streaming applications can treat both past and future data the same way. That is a single application can process historical, stored data but rather than ending when it reaches the last record it can keep processing as future data arrives. This is a generalized notion of stream processing that subsumes batch processing as well as message-driven applications.
Likewise for streaming data pipelines the combination of subscription to real-time events make it possible to use Kafka for very low-latency pipelines; but the ability to store data reliably make it possible to use it for critical data where the delivery of data must be guaranteed or for integration with offline systems that load data only periodically or may go down for extended periods of time for maintenance. The stream processing facilities make it possible to transform data as it arrives.
For more information on the guarantees, apis, and capabilities Kafka provides see the rest of the documentation.

My next blog is about how we use Kafka using python.
Subscribe my blog for further interesting blogs

Friday, 21 April 2017

Intro to ELK and Integrate Kafka with ELK

What is the ELK Stack?

The ELK stack consists of Elasticsearch, Logstash, and Kibana. Although they've all been built to work exceptionally well together, each one is a separate project that is driven by the open-source vendor Elastic—which itself began as an enterprise search platform vendor. It has now become a full-service analytics software company, mainly because of the success of the ELK stack. Wide adoption of Elasticsearch for analytics has been the main driver of its popularity.
Data constantly flows into your systems, but it can quickly grow to be fat and stale. As your data set grows larger, your analytics will slow up, resulting in sluggish insights. And this is likely to be a serious business problem. So, the BIG question for your big data is: how can you maintain valuable business insights?
Not long ago, an epiphany ran through the industry: analytics is, in essence, a search problem that needs coupling with good visualizations. So, there was a marriage: Lucene with all its search goodness was brought together with the distributed-computing goodness that is Elasticsearch. Logstash came onto the scene to normalize all kinds of time-series data. Pop in Kibana's ultra-simple visualization tool, and you have a complete analytics tool that can rival very expensive and scalable solutions from Oracle, Palantir, Tableau, Splunk, Microsoft, and others. You, too, can play with the big boys for a lot less $$$.
Let's ask the question a bit differently. How can you maintain blazing-fast analytics as you data grows larger and larger? Answer: the ELK stack makes it way easier -- and way faster -- to search and analyze large data sets.
We should mention that ELK is quite versatile. Use the stack as a stand-alone application, or integrate with your existing applications to get the most current data. With Elasticsearch, you get all the features to make real-time decisions-all the time. You can use each of these tools separately, or with other products. For example, Kibana often goes together with Solr/Lucene. Although none of these is a project of the Apache Foundation, each part of the stack falls under the Apache 2 License. Elasticsearch owns both the intellectual property and the trademarks.

Elasticsearch — The Amazing Log Search Tool

Elasticsearch is a juggernaut solution for your data extraction problems. A single developer can use it to find the high-value needles underneath all of your data haystacks, so you can put your team of data scientists to work on another project. Consider these benefits:
Real-time data and real-time analytics. The ELK stack gives you the power of real-time data insights, with the ability to perform super-fast data extractions from virtually all structured or unstructured data sources. Real-time extraction, and real-time analytics. Elasticsearch is the engine that gives you both the power and the speed.
Scalable, high-availability, multi-tenant. With Elasticsearch, you can start small and expand it along with your business growth-when you are ready. It is built to scale horizontally out of the box. As you need more capacity, simply add another node and let the cluster reorganize itself to accommodate and exploit the extra hardware. Elasticsearch clusters are resilient, since they automatically detect and remove node failures. You can set up multiple indices and query each of them independently or in combination.
Full text search. Under the cover, Elasticsearch uses Lucene to provide the most powerful full-text search capabilities available in any open-source product. The search features come with multi-language support, an extensive query language, geolocation support, and context-sensitive suggestions, and autocompletion.
Document orientation. You can store complex, real-world entities in Elasticsearch as structured JSON documents. All fields have a default index, and you can use all the indices in a single query to get precise results in the blink of an eye.

Logstash — Routing Your Log Data

Logstash is a tool for log data intake, processing, and output. This includes virtually any type of log that you manage: system logs, webserver logs, error logs, and app logs. As administrators, we know how much time can be spent normalizing data from disparate data sources. We know, for example, how widely Apache logs differ from NGINX logs.
Rather than normalizing with time-sucking ETL (Extract, Transform, and Load), we recommend that you switch over to the fast track. Instead, you could spend much less time training Logstash to normalize the data, getting Elasticsearch to process the data, and then visualize it with Kibana. With Logstash, it's super easy to take all those logs and store them in a central location. The only prerequisite is a Java runtime, and it takes just two commands to get Logstash up and running.
Using Elasticsearch as a backend datastore and Kibana as a frontend dashboard (see below), Logstash will serve as the workhorse for storage, querying and analysis of your logs. Since it has an arsenal of ready-made inputs, filters, codecs, and outputs, you can grab hold of a very powerful feature-set with a very little effort on your part.
Think of Logstash as a pipeline for event processing: it takes precious little time to choose the inputs, configure the filters, and extract the relevant, high-value data from your logs. Take a few more steps, make it available to Elasticsearch and—BAM!—you get super-fast queries against your mountains of data.

Kibana — Visualizing Your Log Data

Kibana is your log-data dashboard. Get a better grip on your large data stores with point-and-click pie charts, bar graphs, trendlines, maps and scatter plots. You can visualize trends and patterns for data that would otherwise be extremely tedious to read and interpret. Eventually, each business line can make practical use of your data collection as you help them customize their dashboards. Save it, share it, and link your data visualizations for quick and smart communication.
If you're using Qbox, then you can easily enable Kibana from your dashboard, which eliminates the need for extra infrastructure. It's too easy to setup, configure, and refine comparisons of your data queries across an adjustable time scale. Choose from several views, including interval or a rolling average.
Dashboard_-_Enable_Kibana.png#asset:366

How Can I Use the ELK Stack to Manage my Log Data?

Your critical business questions have answers in logs of your applications and systems, but most potential users of the data in those logs assume that the accessibility barrier is too high. But the answers are in there -- answers to questions such as:
  • How many account signups this week?
  • What is the effectiveness of our ad campaign?
  • What is the best time to perform system maintenance?
  • Why is my database performance slow?
The answers are in your data, but there are a number of challenges.

The Challenge of Disparate Log Data

If you're like most of us, your log data universe is inconsistent, inaccessible, and inconsistent. We understand problems such as these quite well:

No Consistency — The variety of systems and absence of standards means that it's difficult to be a jack-of-all trades.
  • Logging is different for each app, system, or device
  • Specific knowledge is necessary for interpreting various types of logs
  • Variation in format makes it challenging to search
  • Many types of time formats
No centralization — Simply put, log data is everywhere:
  • Logs in many locations on various servers
  • Many locations of various logs on each server
  • SSH + GREP doesn’t scale or reach
Accessibility of Log Data — Much of the data is difficult to locate and manage. Although some of the log data may be highly valuable, many admins face these steep challenges:
  • Access is often difficult
  • High expertise to mine data
  • Logs can be difficult to find
  • Immense size of Log Data
The ELK stack can help you manage each of these challenges, and more. ELK is best for time-series data-anything with a time stamp-such as you'll find in most web server logs, transaction logs, and stock data listings. To be intelligible, these logs usually need substantial clean-up.
For example, you'll need to normalize in cases where you have some logs in which the timestamp is the North American dd/mm/yy, and others are the European mm/dd/yy. Logstash handles normalizations like this and many others with ease.
Qbox is a dedicated hosting solution for Elasticsearch that aims to be as simple and intuitive as possible for the application developer. Our service is quite similar to any other cloud-hosted database. In the Qbox dashboard, simply launch your own Elasticsearch cluster—a collection of servers that functions as a node. You can add or remove any cluster on the fly, at any time.
After choosing your server size and also your options for security, plugins, and storage, Qbox will provision the cloud resources, install dependencies, attach storage drives, and lock everything down tight. Then we monitor closely and recover in the unlikely event that it's necessary. We handle all of these details so that you can focus on getting the data you need.

We've got what it takes to help you build the right search platform for your business, and all of our service offerings include fanatical technical support. You'll benefit from our deep experience in planning, deploying, and managing configurations for all kinds of companies.

The Basics

Let's get some basic concepts out of the way.
Apache Kafka is publish-subscribe messaging rethought as a distributed commit log
Kafka was created at LinkedIn to handle large volumes of event data. Like many other message brokers, it deals with publisher-consumer and queue semantics by grouping data into topics. As an application, you write to a topic and consume from a topic. An important distinction, or a shift in design with Kafka is that the complexity moves from producer to consumers, and it heavily uses the file system cache. These design decisions, coupled with it being distributed from scratch, makes it a winner in many high volume streaming use cases.

Logstash integrates natively with Kafka using the Java API's. It provides both imput and output plugins so you can read and write to Kafka from Logstash directly. The configuration to get started is pretty simple:

kafka {
   zk_connect => "hostname:port"
   topic_id => "apache_logs"
   ...
}
Kafka has a dependency on Apache ZooKeeper, so if you are running Kafka, you'll need access to a ZooKeeper cluster. More on that later.

When To Use Kafka With The Elastic Stack?

Scenario 1: Event Spikes
Log data or event based data rarely have a consistent, predictable volume or flow rates. Consider a scenario where you upgraded an application on a Friday night (why you shouldn't upgrade on a Friday is for a different blog :) ). The app you deployed has a bad bug where information is logged excessively, flooding your logging infrastructure. This spike or a burst of data is fairly common in other multi-tenant use cases as well, for example, in the gaming and e-commerce industries. A message broker like Kafka is used in this scenario to protect Logstash and Elasticsearch from this surge.

In this architecture, processing is typically split into 2 separate stages — the Shipper and Indexer stages. The Logstash instance that receives data from different data sources is called a Shipper as it doesn't do much processing. Its responsibility is to immediately persist data received to a Kafka topic, and hence, its a producer. On the other side, a Logstash instance — a beefier one — will consume data, at its own throttled speed, while performing expensive transformations like Grok, DNS lookup and indexing into Elasticsearch. This instance is called the Indexer.

While Logstash has traditionally been used as the Shipper, we strongly recommend using the suite of Elastic Beats products available as specialized shippers. Filebeat, for example, is a lightweight, resource friendly agent which can follow files and ship to Kafka via a Logstash receiver.
Kafka


Scenario 2: Elasticsearch not reachable

Consider another scenario. You're planning to upgrade your multi-node Elasticsearch cluster from 1.7 to 2.3 which requires a full cluster restart. Or, a situation where Elasticsearch is down for a longer period of time than you expected. If you have a number of data sources streaming into Elasticsearch, and you can't afford to stop the original data sources, a message broker like Kafka could be of help here! If you use the Logstash shipper and indexer architecture with Kafka, you can continue to stream your data from edge nodes and hold them temporarily in Kafka. As and when Elasticsearch comes back up, Logstash will continue where it left off, and help you catch up to the backlog of data. In fact, this bodes well with the Elastic nature of our software — you can temporarily increase your processing and indexing power by adding extra Logstash instances to consume from the same Kafka topic. You could additionally add extra nodes in Elasticsearch as well. Scaling horizontally without too much hand-holding is one of the core features of Elasticsearch. Once you are caught up, you can scale down to your original number of instances.

Anti-pattern: When not to use Kafka with Elastic Stack

Just as it is good to know when to use Kafka, it is also good knowledge to know when not to use it. Everything has a cost — Kafka is yet another piece of software you need to tend to, in your production environment. This involves monitoring, reacting to alerts, upgrading and everything else that comes with running a software successfully in production. You are monitoring all your production software, aren't you?
When it comes to centralized log management, there is often a blanket statement made that logs need to be shipped off your edge nodes as soon as possible. While this may be true for some use cases, ask yourself if this is really a requirement for you! If you can tolerate a relaxed search latency, you can completely skip the use of Kafka. Filebeat, which follows and ships file content from edge nodes, is resilient to log rotations. This means if your application is emitting more logs than Logstash/Elasticsearch can ingest at real time, logs can be rotated — using Log4j or logrotate, for example — across files, but they will still be indexed. Of course, this brings in a separate requirement of having sufficient disk space to house these logs on your server machines. In other words, in this scenario, your local filesystem will become the temporary buffer.

Bash scripting

Introduction

This page is mostly foundation information. It's kinda boring but essential stuff that will help you to appreciate why and how certian things behave the way they do once we start playing about with the fun stuff (which I promise we'll do in the next section). Taking the time to read and understand the material in this section will make the other sections easier to digest so persevere and it'll be well worth your time.

So what are they exactly?

Think of a script for a play, or a movie, or a TV show. The script tells the actors what they should say and do. A script for a computer tells the computer what it should do or say. In the context of Bash scripts we are telling the Bash shell what it should do.
A Bash script is a plain text file which contains a series of commands. These commands are a mixture of commands we would normally type ouselves on the command line (such as ls or cp for example) and commands we could type on the command line but generally wouldn't (you'll discover these over the next few pages). An important point to remember though is:
Anything you can run normally on the command line can be put into a script and it will do exactly the same thing. Similarly, anything you can put into a script can also be run normally on the command line and it will do exactly the same thing.
You don't need to change anything. Just type the commands as you would normally and they will behave as they would normally. It's just that instead of typing them at the command line we are now entering them into a plain text file. In this sense, if you know how to do stuff at the command line then you already know a fair bit in terms of Bash scripting.
It is convention to give files that are Bash scripts an extension of .sh (myscript.sh for example). As you would be aware (and if you're not maybe you should consider reviewing our Linux Tutorial), Linux is an extensionless system so a script doesn't necessarily have to have this characteristic in order to work.

How do they work?

This is just a little bit of background knowledge. It's not necessary to understand this in order to write scripts but it can be useful to know once you start getting into more complex scripts (and scripts that call and rely on other scripts once you start getting really fancy).
In the realm of Linux (and computers in general) we have the concept of programs and processes. A program is a blob of binary data consisting of a series of instructions for the CPU and possibly other resources (images, sound files and such) organised into a package and typically stored on your hard disk. When we say we are running a program we are not really running the program but a copy of it which is called a process. What we do is copy those instructions and resources from the hard disk into working memory (or RAM). We also allocate a bit of space in RAM for the process to store variables (to hold temporary working data) and a few flags to allow the operating system (OS) to manage and track the process during it's execution.
Essentially a process is a running instance of a program.
There could be several processes representing the same program running in memory at the same time. For example I could have two terminals open and be running the command cp in both of them. In this case there would be two cp processes currently existing on the system. Once they are finished running the system then destroys them and there are no longer any processes representing the program cp.
When we are at the terminal we have a Bash process running in order to give us the Bash shell. If we start a script running it doesn't actually run in that process but instead starts a new process to run inside. We'll demonstrate this in the next section on variables and it's implications should become clearer. For the most part you don't need to worry too much about this phenomenon however.

How do we run them?

Running a Bash script is fairly easy. Another term you may come across is executing the script (which means the same thing). Before we can execute a script it must have the execute permission set (for safety reasons this persmission is generally not set by default). If you forget to grant this permission before running the script you'll just get an error message telling you as such and no harm will be done.
  1. ./myscript.sh
  2. bash: ./myscript.sh: Permission denied
  3. ls -l myscript.sh
  4. -rw-r--r-- 18 ryan users 4096 Feb 17 09:12 myscript.sh
  5. chmod 755 myscript.sh
  6. ls -l myscript.sh
  7. -rwxr-xr-x 18 ryan users 4096 Feb 17 09:12 myscript.sh
  8. ./myscript.sh
  9. Hello World!
The shorthand 755 is often used for scripts as it allows you the owner to write or modify the script and for everyone to execute the script.
Here are the contents of myscript.sh

myscript.sh

  1. #!/bin/bash
  2. # A sample Bash script, by Ryan
  3. echo Hello World!
Let's break it down:

  • Line 1 - Is what's referred to as the shebang. See below for what this is.
  • Line 2 - This is a comment. Anything after # is not executed. It is for our reference only.
  • Line 4 - Is the command echo which will print a message to the screen. You can type this command yourself on the command line and it will behave exactly the same.
  • The syntax highlighting is there only to make it easier to read and is not something you need to do in your own files (remember they are just plain text files).

Why the ./

You've possibly noticed that when we run a normal command (such as ls) we just type its name but when running the script above I put a ./ in front of it. When you just type a name on the command line Bash tries to find it in a series of directories stored in a variable called $PATH. We can see the current value of this variable using the command echo (you'll learn more about variables in the next section).
  1. echo $PATH
  2. /home/ryan/bin:/usr/local/bin:/usr/bin:/bin
The directories are separated by " : "
Bash only looks in those specific directories and doesn't consider sub directories or your current directory. It will look through those directories in order and execute the first instance of the program or script that it finds.
The $PATH variable is an individual user variable so each user on a system may set it to suit themselves.
This is done for a few different reasons.
  • It allows us to have several different versions of a program installed. We can control which one gets executed based on where it sits in our $PATH.
  • It allows for convenience. As you saw above, the first directory for myself is a bin directory in my home directory. This allows me to put my own scripts and programs there and then I can use them no matter where I am in the system by just typing their name. I could even create a script with the same name as a program (to act as a wrapper) if I wanted slightly different behaviour.
  • It increases safety - For example a malicious user could create a script called ls which actually deletes everything in your home directory. You wouldn't want to inadvertantly run that script. But as long as it's not in your $PATH that won't happen.
If a program or script is not in one of the directories in your $PATH then you can run it by telling Bash where it should look to find it. You do so by including either an absolute or relative path in front of the program or script name. You'll remember that dot ( . ) is actually a reference to your current directory. Assuming this script is in my home directory I could also have run it by using an absolute path.
  1. /home/ryan/myscript.sh
  2. Hello World!
Variables

In this example we declare simple bash variable and print it on the screen ( stdout ) with echo command.

#!/bin/bash
 STRING="HELLO WORLD!!!"
 echo $STRING 

Bash string Variables in bash script

Your backup script and variables:

#!/bin/bash
 OF=myhome_directory_$(date +%Y%m%d).tar.gz
 tar -czf $OF /home/linuxconfig 

Bash backup Script with bash Variables

Global vs. Local variables

#!/bin/bash
#Define bash global variable
#This variable is global and can be used anywhere in this bash script
VAR="global variable"
function bash {
#Define bash local variable
#This variable is local to bash function only
local VAR="local variable"
echo $VAR
}
echo $VAR
bash
# Note the bash global variable did not change
# "local" is bash reserved word
echo $VAR

Global vs. Local Bash variables in bash script
Passing arguments to the bash script

#!/bin/bash
# use predefined variables to access passed arguments
#echo arguments to the shell
echo $1 $2 $3 ' -> echo $1 $2 $3'

# We can also store arguments from bash command line in special array
args=("$@")
#echo arguments to the shell
echo ${args[0]} ${args[1]} ${args[2]} ' -> args=("$@"); echo ${args[0]} ${args[1]} ${args[2]}'

#use $@ to print out all arguments at once
echo $@ ' -> echo $@'

# use $# variable to print out
# number of arguments passed to the bash script
echo Number of arguments passed: $# ' -> echo Number of arguments passed: $#' 

/arguments.sh Bash Scripting Tutorial 

Passing arguments to the bash script
Executing shell commands with bash

#!/bin/bash
# use backticks " ` ` " to execute shell command
echo `uname -o`
# executing bash command without backticks
echo uname -o 

Executing shell commands with bash
Reading User Input

#!/bin/bash
 
echo -e "Hi, please type the word: \c "
read  word
echo "The word you entered is: $word"
echo -e "Can you please enter two words? "
read word1 word2
echo "Here is your input: \"$word1\" \"$word2\""
echo -e "How do you feel about bash scripting? "
# read command now stores a reply into the default build-in variable $REPLY
read
echo "You said $REPLY, I'm glad to hear that! "
echo -e "What are your favorite colours ? "
# -a makes read command to read into an array
read -a colours
echo "My favorite colours are also ${colours[0]}, ${colours[1]} and ${colours[2]}:-)" 

Reading User Input with bash

#!/bin/bash
 
echo -e "Hi, please type the word: \c "
read  word
echo "The word you entered is: $word"
echo -e "Can you please enter two words? "
read word1 word2
echo "Here is your input: \"$word1\" \"$word2\""
echo -e "How do you feel about bash scripting? "
# read command now stores a reply into the default build-in variable $REPLY
read
echo "You said $REPLY, I'm glad to hear that! "
echo -e "What are your favorite colours ? "
# -a makes read command to read into an array
read -a colours
echo "My favorite colours are also ${colours[0]}, ${colours[1]} and ${colours[2]}:-)" 

Flask Python API library

15:24 Posted by SRE Hacks , , , , , , , , , No comments
Eager to get started? This page gives a good introduction to Flask. It assumes you already have Flask installed.

Requirements

If you have a computer that runs Python then you are probably good to go. The tutorial application should run just fine on  Linux. Unless noted, the code presented in these articles has been tested against Python 2.7 and 3.4, though it will likely be okay if you use a newer 3.x release.

You should use pip to install and deploy Flask. To install Flask generally on your system, give this command on the command prompt:
       pip install flask
Note that you can also specify the Flask version, should you need (you won't need this one):
       pip install flask=0.10
This should install Flask and everything it depends on. Don't be surprised if you find it has installed several Python modules as a result.

Flask should now be installed! Now, time to create our first app.

A Minimal Application

A minimal Flask application looks something like this:
from flask import Flask
app = Flask(__name__)

@app.route('/')
def hello_world():
    return 'Hello, World!'
So what did that code do?
  1. First we imported the Flask class. An instance of this class will be our WSGI application.
  2. Next we create an instance of this class. The first argument is the name of the application’s module or package. If you are using a single module (as in this example), you should use __name__ because depending on if it’s started as application or imported as module the name will be different ('__main__' versus the actual import name). This is needed so that Flask knows where to look for templates, static files, and so on. For more information have a look at the Flask documentation.
  3. We then use the route() decorator to tell Flask what URL should trigger our function.
  4. The function is given a name which is also used to generate URLs for that particular function, and returns the message we want to display in the user’s browser.
Just save it as hello.py or something similar. Make sure to not call your application flask.py because this would conflict with Flask itself.
To run the application you can either use the flask command or python’s -m switch with Flask. Before you can do that you need to tell your terminal the application to work with by exporting the FLASK_APP environment variable:
$ export FLASK_APP=hello.py
$ flask run
 * Running on http://127.0.0.1:5000/
If you are on Windows you need to use set instead of export.
Alternatively you can use python -m flask:
$ export FLASK_APP=hello.py
$ python -m flask run
 * Running on http://127.0.0.1:5000/
This launches a very simple builtin server, which is good enough for testing but probably not what you want to use in production.
Now head over to http://127.0.0.1:5000/, and you should see your hello world greeting.
Externally Visible Server
If you run the server you will notice that the server is only accessible from your own computer, not from any other in the network. This is the default because in debugging mode a user of the application can execute arbitrary Python code on your computer.
If you have the debugger disabled or trust the users on your network, you can make the server publicly available simply by adding --host=0.0.0.0 to the command line:
flask run --host=0.0.0.0
This tells your operating system to listen on all public IPs.

What to do if the Server does not Start

In case the python -m flask fails or flask does not exist, there are multiple reasons this might be the case. First of all you need to look at the error message.

Old Version of Flask

Versions of Flask older than 0.11 use to have different ways to start the application. In short, the flask command did not exist, and neither did python -m flask.

Invalid Import Name

The FLASK_APP environment variable is the name of the module to import at flask run. In case that module is incorrectly named you will get an import error upon start (or if debug is enabled when you navigate to the application). It will tell you what it tried to import and why it failed.
The most common reason is a typo or because you did not actually create an app object.

Debug Mode

(Want to just log errors and stack traces? )
The flask script is nice to start a local development server, but you would have to restart it manually after each change to your code. That is not very nice and Flask can do better. If you enable debug support the server will reload itself on code changes, and it will also provide you with a helpful debugger if things go wrong.
To enable debug mode you can export the FLASK_DEBUG environment variable before running the server:
$ export FLASK_DEBUG=1
$ flask run
(On Windows you need to use set instead of export).
This does the following things:
  1. it activates the debugger
  2. it activates the automatic reloader
  3. it enables the debug mode on the Flask application.
Attention
Even though the interactive debugger does not work in forking environments (which makes it nearly impossible to use on production servers), it still allows the execution of arbitrary code. This makes it a major security risk and therefore it must never be used on production machines.

GDB and it's use

15:15 Posted by SRE Hacks , , , , , , No comments

What is GDB?

GDB, the GNU Project debugger, allows you to see what is going on `inside' another program while it executes -- or what another program was doing at the moment it crashed.
GDB can do four main kinds of things (plus other things in support of these) to help you catch bugs in the act:
  • Start your program, specifying anything that might affect its behavior.
  • Make your program stop on specified conditions.
  • Examine what has happened, when your program has stopped.
  • Change things in your program, so you can experiment with correcting the effects of one bug and go on to learn about another.
The program being debugged can be written in Ada, C, C++, Objective-C, Pascal (and many other languages). Those programs might be executing on the same machine as GDB (native) or on another machine (remote). GDB can run on most popular UNIX and Microsoft Windows variants.

GDB is a well known debugger library for  c and c++.  GDB is usually use for large and distributed system debugging. GDB is command line tool and has almost all function that you use in debugging using IDE.
I have explain some basic and useful methods of GDB that help up in learning GDB and debugging your programs
Installation

Before you go for installation first check either GDB is already installed or not. You check using this command
gd -help

I GDB is already installed on your machine, it shows all the available options of GDB.
If not installed it show message to install GDB.  Then you install it manually but first check these prerequisites
  • An ANSI-compliant C compiler (gcc is recommended - note that gdb can debug codes generated by other compilers)
  • 115 MB of free disk space is required on the partition on which you're going to build gdb.

  • 20 MB of free disk space is required on the partition on which you're going to install gdb.
Now run this command to install GDB
sudo apt-get install gdb

 GDB Command Line Arguments:
Starting GDB:
  • gdb name-of-executable
  • gdb -e name-of-executable -c name-of-core-file
  • gdb name-of-executable --pid=process-id
    Use ps -auxw to list process id's: Attach to a process already running:
    [prompt]$ ps -auxw | grep myapp
    user1     2812  0.7  2.0 1009328 164768 ?      Sl   Jun07   1:18 /opt/bin/myapp
    [prompt]$ gdb /opt/bin/myapp 2812
    OR
    [prompt]$ gdb /opt/bin/myapp --pid=2812
                
Command line options: (version 6. Older versions use a single "-")
Option Description
--help
-h
List command line arguments
--exec=file-name
-e file-name
Identify executable associated with core file.
--core=name-of-core-file
-c name-of-core-file
Specify core file.
--command=command-file
-x command-file
File listing GDB commands to perform. Good for automating set-up.
--directory=directory
-d directory
Add directory to the path to search for source files.
--cd=directory Run GDB using specified directory as the current working directory.
--nx
-n
Do not execute commands from ~/.gdbinit initialization file. Default is to look at this file and execute the list of commands.
--batch -x command-file Run in batch (not interactive) mode. Execute commands from file. Requires -x option.
--symbols=file-name
-s file-name
Read symbol table from file file.
--se=file-name Use FILE as symbol file and executable file.
--write Enable writing into executable and core files.
--quiet
-q
Do not print the introductory and copyright messages.
--tty=device Specify device for running program's standard input and output.
--tui Use a terminal user interface. Console curses based GUI interface for GDB. Generates a source and debug console area.
--pid=process-id
-p process-id
Specify process ID number to attach to.
--version Print version information and then exit.

GDB Commands:
Commands used within GDB:


Command Description
help List gdb command topics.
help topic-classes List gdb command within class.
help command Command description.
eg help show to list the show commands
apropos search-word Search for commands and command topics containing search-word.
info args
i args
List program command line arguments
info breakpoints List breakpoints
info break List breakpoint numbers.
info break breakpoint-number List info about specific breakpoint.
info watchpoints List breakpoints
info registers List registers in use
info threads List threads in use
info set List set-able option
Break and Watch
break funtion-name
break line-number
break ClassName::functionName
Suspend program at specified function of line number.
break +offset
break -offset
Set a breakpoint specified number of lines forward or back from the position at which execution stopped.
break filename:function Don't specify path, just the file name and function name.
break filename:line-number Don't specify path, just the file name and line number.
break Directory/Path/filename.cpp:62
break *address Suspend processing at an instruction address. Used when you do not have source.
break line-number if condition Where condition is an expression. i.e. x > 5
Suspend when boolean expression is true.
break line thread thread-number Break in thread at specified line number. Use info threads to display thread numbers.
tbreak Temporary break. Break once only. Break is then removed. See "break" above for options.
watch condition Suspend processing when condition is met. i.e. x > 5
clear
clear function
clear line-number
Delete breakpoints as identified by command option.
Delete all breakpoints in function
Delete breakpoints at a given line
delete
d
Delete all breakpoints, watchpoints, or catchpoints.
delete breakpoint-number
delete range
Delete the breakpoints, watchpoints, or catchpoints of the breakpoint ranges specified as arguments.
disable breakpoint-number-or-range
enable breakpoint-number-or-range
Does not delete breakpoints. Just enables/disables them.
Example:
Show breakpoints: info break
Disable: disable 2-9
enable breakpoint-number once Enables once
continue
c
Continue executing until next break point/watchpoint.
continue number Continue but ignore current breakpoint number times. Usefull for breakpoints within a loop.
finish Continue to end of function.
Line Execution
step
s
step number-of-steps-to-perform
Step to next line of code. Will step into a function.
next
n
next number
Execute next line of code. Will not enter functions.
until
until line-number
Continue processing until you reach a specified line number. Also: function name, address, filename:function or filename:line-number.
info signals
info handle
handle SIGNAL-NAME option
Perform the following option when signal recieved: nostop, stop, print, noprint, pass/noignore or nopass/ignore
where Shows current line number and which function you are in.
Stack
backtrace
bt
bt inner-function-nesting-depth
bt -outer-function-nesting-depth
Show trace of where you are currently. Which functions you are in. Prints stack backtrace.
backtrace full Print values of local variables.
frame
frame number
f number
Show current stack frame (function where you are stopped)
Select frame number. (can also user up/down to navigate frames)
up
down
up number
down number
Move up a single frame (element in the call stack)
Move down a single frame
Move up/down the specified number of frames in the stack.
info frame List address, language, address of arguments/local variables and which registers were saved in frame.
info args
info locals
info catch
Info arguments of selected frame, local variables and exception handlers.
Source Code
list
l
list line-number
list function
list -
list start#,end#
list filename:function
List source code.
set listsize count
show listsize
Number of lines listed when list command given.
directory directory-name
dir directory-name
show directories
Add specified directory to front of source code path.
directory Clear sourcepath when nothing specified.
Machine Language
info line
info line number
Displays the start and end position in object code for the current line in source.
Display position in object code for a specified line in source.
disassemble 0xstart 0xend Displays machine code for positions in object code specified (can use start and end hex memory values given by the info line command.
stepi
si
nexti
ni
step/next assembly/processor instruction.
x 0xaddress
x/nfu 0xaddress
Examine the contents of memory.
Examine the contents of memory and specify formatting.
  • n: number of display items to print
  • f: specify the format for the output
  • u: specify the size of the data unit (eg. byte, word, ...)
Example: x/4dw var
Examine Variables
print variable-name
p variable-name
p file-name::variable-name
p 'file-name'::variable-name
Print value stored in variable.
p *array-variable@length Print first # values of array specified by length. Good for pointers to dynamicaly allocated memory.
p/x variable Print as integer variable in hex.
p/d variable Print variable as a signed integer.
p/u variable Print variable as a un-signed integer.
p/o variable Print variable as a octal.
p/t variable
x/b address
x/b &variable
Print as integer value in binary. (1 byte/8bits)
p/c variable Print integer as character.
p/f variable Print variable as floating point number.
p/a variable Print as a hex address.
x/w address
x/4b &variable
Print binary representation of 4 bytes (1 32 bit word) of memory pointed to by address.
ptype variable
ptype data-type
Prints type definition of the variable or declared variable type. Helpful for viewing class or struct definitions while debugging.
GDB Modes
set gdb-option value Set a GDB option
set logging on
set logging off
show logging
set logging file log-file
Turn on/off logging. Default name of file is gdb.txt
set print array on
set print array off
show print array
Default is off. Convient readable format for arrays turned on/off.
set print array-indexes on
set print array-indexes off
show print array-indexes
Default off. Print index of array elements.
set print pretty on
set print pretty off
show print pretty
Format printing of C structures.
set print union on
set print union off
show print union
Default is on. Print C unions.
set print demangle on
set print demangle off
show print demangle
Default on. Controls printing of C++ names.
Start and Stop
run
r
run command-line-arguments
run < infile > outfile
Start program execution from the beginning of the program. The command break main will get you started. Also allows basic I/O redirection.
continue
c
Continue execution to next break point.
kill Stop program execution.
quit
q
Exit GDB debugger.

 GDB Operation:


  • Compile with the "-g" option (for most GNU and Intel compilers) which generates added information in the object code so the debugger can match a line of source code with the step of execution.
  • Do not use compiler optimization directive such as "-O" or "-O2" which rearrange computing operations to gain speed as this reordering will not match the order of execution in the source code and it may be impossible to follow.
  • control+c: Stop execution. It can stop program anywhere, in your source or a C library or anywhere.
  • To execute a shell command: ! command
    or shell command
  • GDB command completion: Use TAB key
    info bre + TAB will complete the command resulting in info breakpoints
    Press TAB twice to see all available options if more than one option is available or type "M-?" + RETURN.
  • GDB command abreviation:
    info bre + RETURN will work as bre is a valid abreviation for breakpoints